EQUITY
See the shape of your progress.
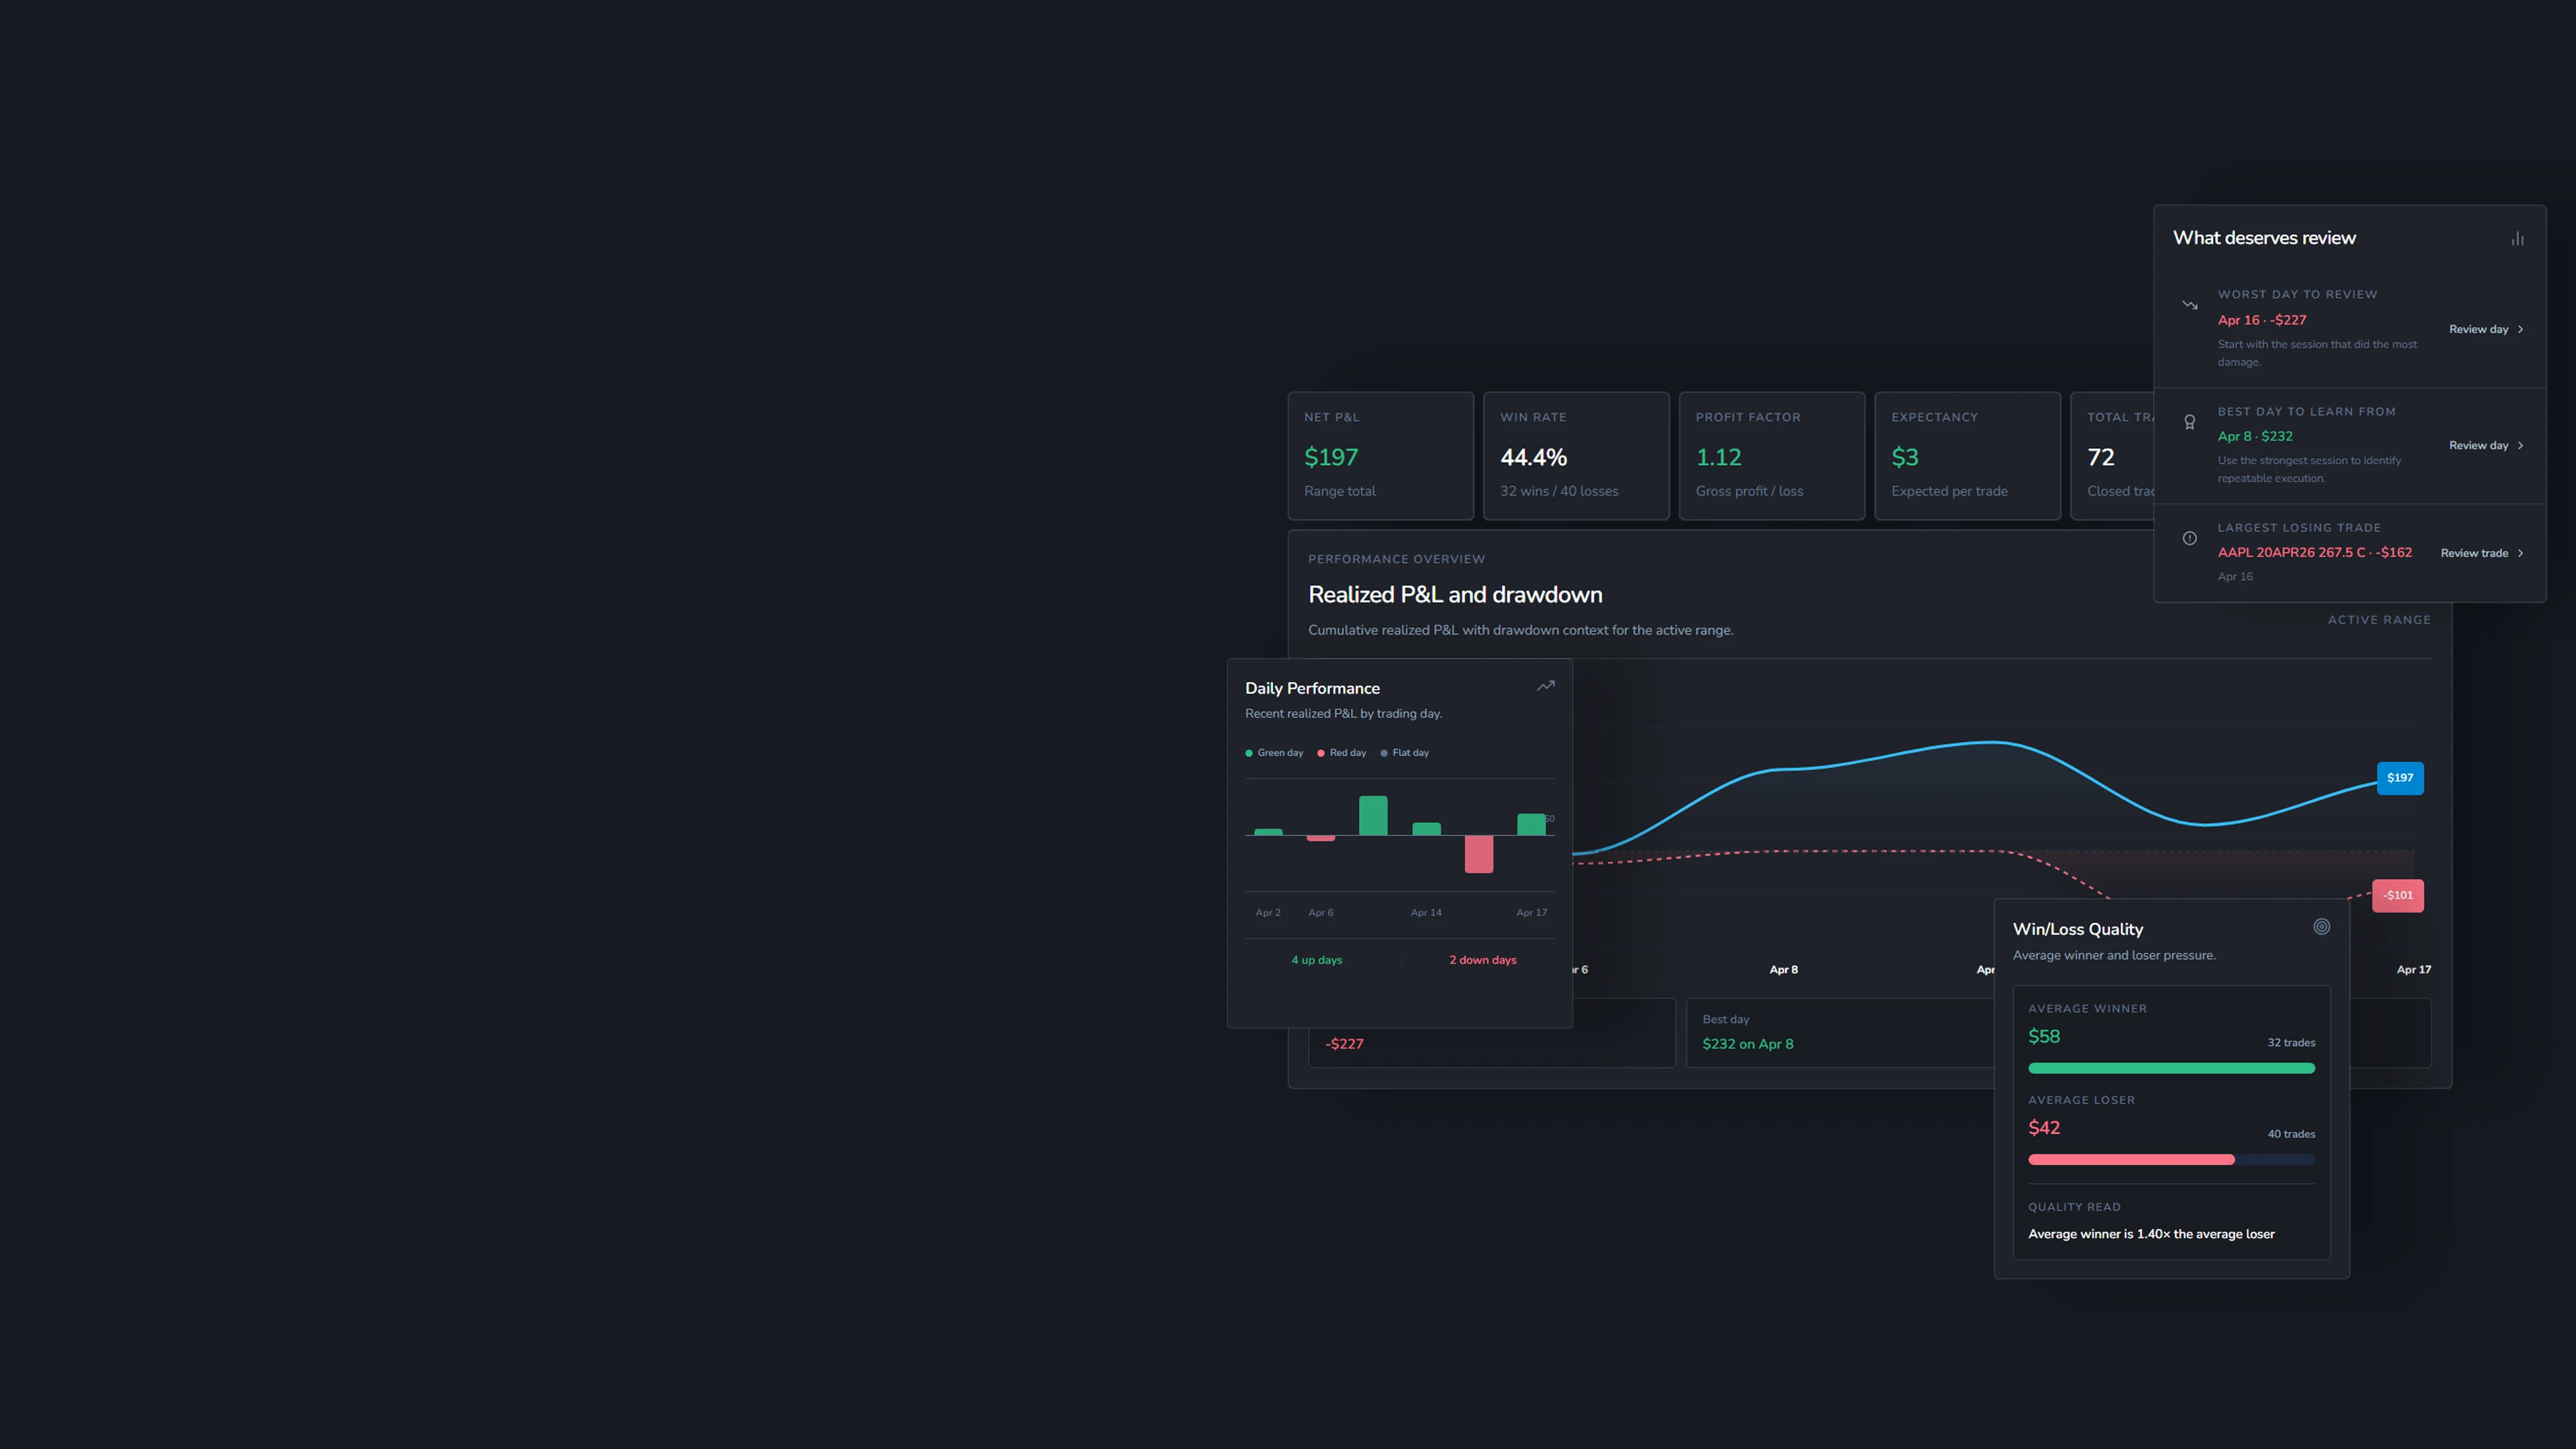
Track realized performance over time so your results read like a process, not isolated wins and losses.
- Equity curve
- Drawdown context
- Best and worst periods

Performance Analytics
Review equity, win rate, expectancy, profit factor, timing, consistency, and risk behavior across your trading history, then see which patterns are actually helping or hurting your results.
Performance context
A green month can still hide bad habits. A red week can still contain good execution. Weezpr helps you review realized performance, aggregate metrics, timing, and behavior patterns using your own trading data.
Is the equity curve improving or just recovering?
Which sessions are creating the most damage?
Are timing, consistency, and review habits improving?
What you can review
The point is not more charts for their own sake. It is to turn your trading journal data into retrospective statistics that connect performance, timing, and behavior in a clearer review process.
See how Performance Analytics fits into the Weezpr trading journalEquity curve
Win rate
Profit factor
Expectancy
Net ROI
Best and worst days
Timing patterns
Consistency signals
EQUITY
Track realized performance over time so your results read like a process, not isolated wins and losses.
TIMING
Review performance by day, session, and trading rhythm so stronger and weaker windows become easier to see.
Review trading days in Calendar and Day ReviewCONSISTENCY
Compare win rate, expectancy, profit factor, and review behavior so you can spot whether your process is actually improving.
Review posture
Weezpr does not provide trade signals or financial advice. It helps you review your own trading data, behavior, and outcomes.
Private beta access is limited while we improve Weezpr with real users.